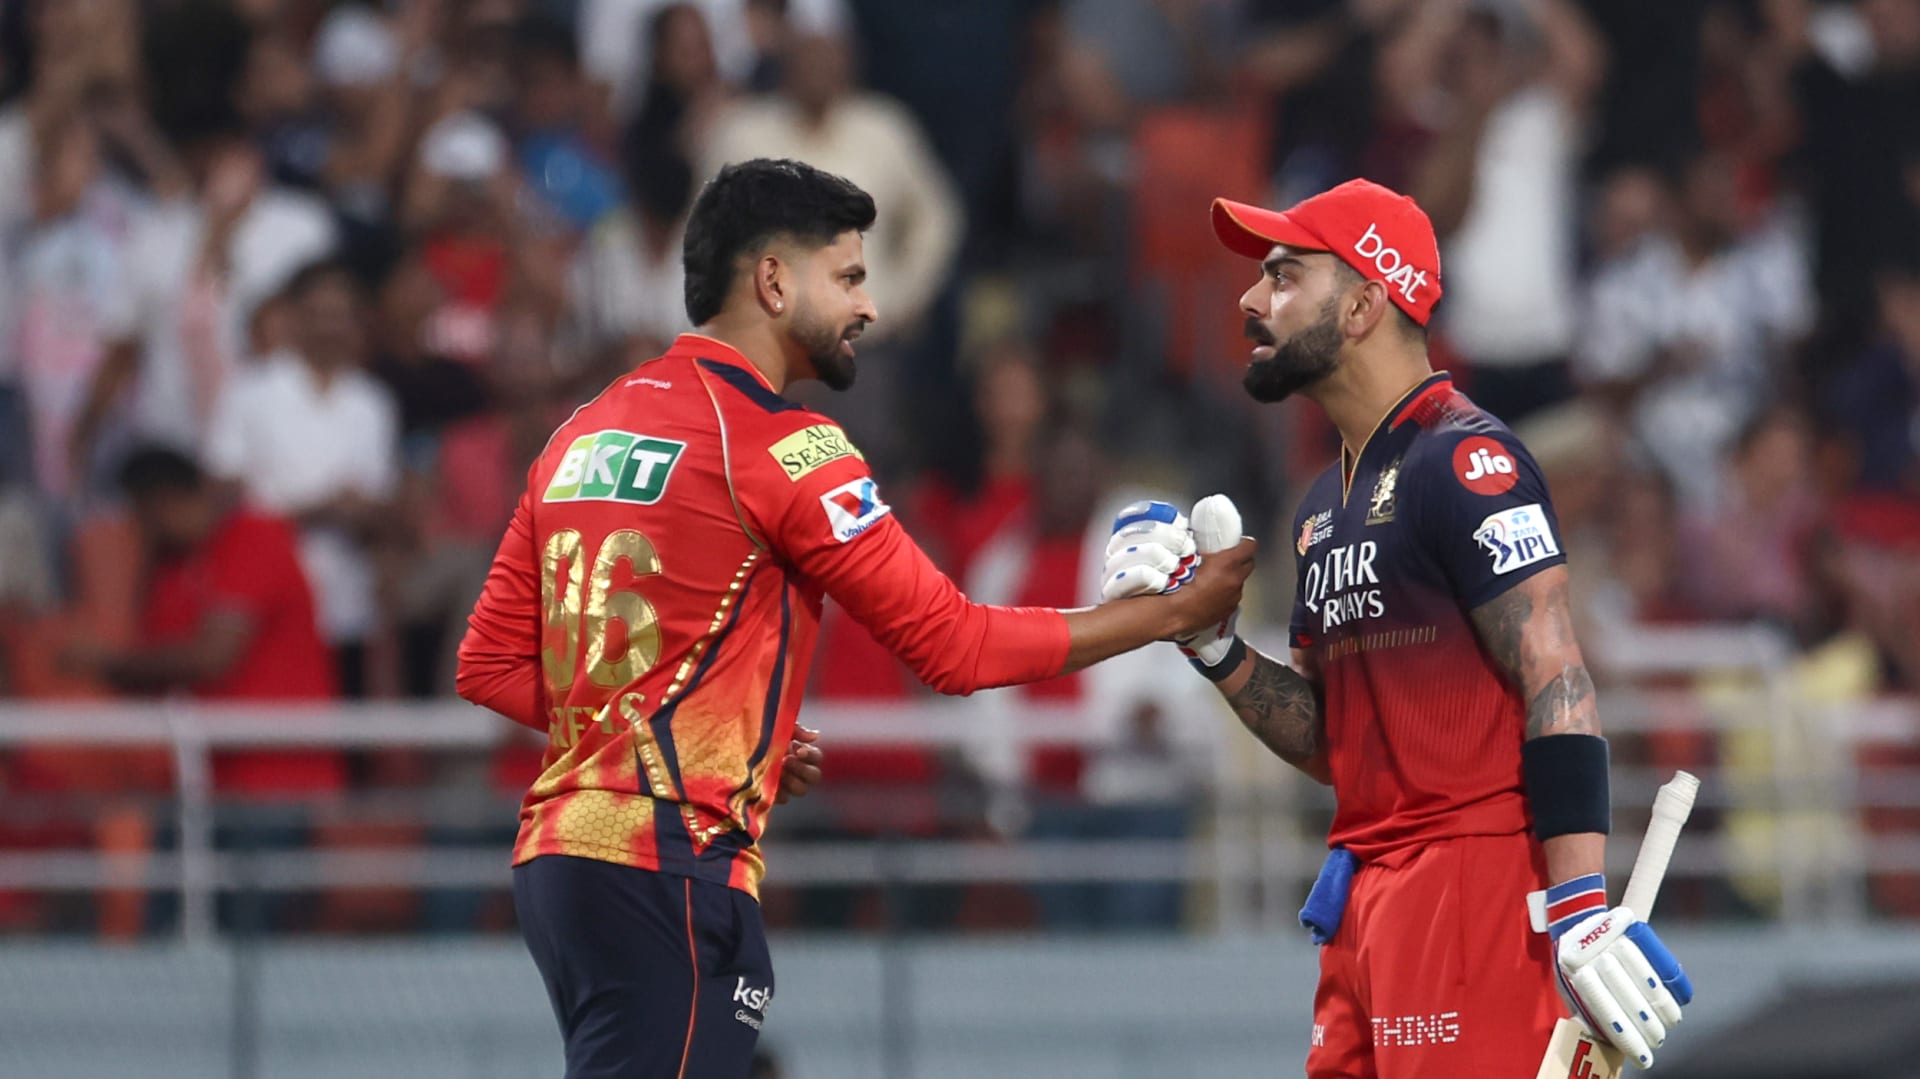
The Indian Premier League (IPL) has transformed T20 cricket into a competition where explosive batting, intelligent bowling, tactical decisions and individual brilliance combine to create unforgettable matches. Since its launch in 2008, the tournament has produced remarkable performances, dramatic finishes and records that continue to shape conversations among cricket fans. Statistics help explain these moments by showing how players perform under pressure, which teams maintain consistency and what separates an ordinary performance from an exceptional one.
For fans who want to understand the game beyond the final score, IPL stats provide a detailed picture of how matches unfold. Batting averages, strike rates, centuries, wickets, economy rates and team win percentages reveal different aspects of performance. A batter scoring 70 runs from 35 deliveries, for example, may have a greater impact during a high-scoring chase than someone scoring 70 from 60 deliveries. Similarly, a bowler taking two wickets while conceding very few runs can influence a match as significantly as a batter hitting a quick half-century.
Understanding these numbers also makes it easier to compare players from different seasons and evaluate changing strategies. The IPL has evolved through changes in team combinations, playing conditions, tactical approaches and scoring expectations. Consequently, statistics are most useful when considered alongside match situations and historical context rather than as isolated numbers.
Understanding the Most Important IPL Statistics
Cricket statistics are valuable because they turn individual performances into measurable information. Total runs, wickets, batting average, strike rate, bowling economy and match results are among the most commonly studied numbers in the tournament. Each metric answers a different question. Total runs indicate a batter’s accumulated contribution, while the average helps measure consistency. Strike rate shows how quickly runs are scored, and economy rate measures how many runs a bowler concedes per over. When these figures are studied together, they provide a more balanced assessment of performance.
For example, an opening batter may score 450 runs during a season with a moderate strike rate, helping the team build reliable foundations across several matches. Another batter might score fewer runs but maintain a much higher strike rate, making a major difference during the final overs. Neither performance can be judged properly by total runs alone. Similarly, a bowler who takes wickets regularly but concedes expensive overs has a different role from a defensive bowler who limits scoring opportunities. The most meaningful IPL stats therefore combine individual figures with match conditions, batting positions, opposition quality and the team’s objectives.
IPL Batting Records and Outstanding Run Scorers
Batting records remain among the most popular subjects for IPL followers. Fans regularly compare leading run scorers, centuries, half-centuries, sixes, fours and individual innings. These achievements reveal how different generations of players have adapted to the fast pace of franchise cricket. Experienced batters often build their innings through placement and timing, while aggressive hitters may target boundaries early to put pressure on the opposition. Successful T20 batting requires both approaches, with players adjusting their methods according to the situation.
Virat Kohli has established himself as a major figure in IPL batting history through his long career, consistency and ability to perform across different match situations. His remarkable 973-run season in 2016 remains one of the competition’s most notable individual achievements. Chris Gayle’s explosive 175 not out for Royal Challengers Bengaluru against Pune Warriors India in 2013 also remains a landmark innings. These performances demonstrate two different ways of making history: sustained run production across a season and extraordinary scoring in a single match. Such records help fans understand why some players become central to the league’s history.
The Importance of Batting Average and Strike Rate
A batting average generally indicates how many runs a player scores per dismissal. It is calculated by dividing total runs by the number of times the batter has been dismissed. A higher average can indicate consistency, although it must be considered alongside the player’s role and strike rate. Middle-order batters who frequently enter difficult situations may face different challenges from openers who benefit from fielding restrictions during the powerplay.
Strike rate measures runs scored per 100 balls faced. A batter scoring 60 runs from 30 deliveries has a strike rate of 200, while a batter scoring 60 from 50 deliveries has a strike rate of 120. Both players have scored the same number of runs, but their scoring speed differs considerably. This distinction becomes particularly important when a team is chasing a demanding target or attempting to accelerate during the final overs. Reading these measurements together provides a clearer understanding of a batter’s contribution than relying on a single statistic.
IPL Bowling Records and Wicket-Taking Achievements
Bowling statistics are equally important because bowlers determine how difficult it is for the opposition to build an innings. Wicket totals, bowling averages, economy rates, strike rates and best bowling figures help describe a player’s effectiveness. Some bowlers specialise in taking wickets during the powerplay, when batters are trying to exploit fielding restrictions. Others focus on controlling the middle overs or defending runs at the end of an innings. These responsibilities require different skills, which is why bowling figures should always be interpreted within their tactical context.
Yuzvendra Chahal has become a leading name in the IPL’s all-time wicket-taking records, demonstrating the value of leg-spin in a format often associated with aggressive batting. Bhuvneshwar Kumar has also built an impressive record through swing bowling, variations and experience across different phases of an innings. Meanwhile, bowlers such as Jasprit Bumrah are recognised for their ability to execute accurate yorkers, slower deliveries and changes of pace under pressure. Their performances show that successful bowling is not simply about taking wickets; controlling the scoring rate and creating difficult decisions for batters can be just as important.
Bowling Economy, Average and Strike Rate
Bowling economy measures the average number of runs conceded per over. A lower economy rate generally indicates that a bowler has restricted scoring effectively. Bowling average measures the number of runs conceded for each wicket taken, while bowling strike rate represents the number of deliveries required to take a wicket on average. Together, these three figures provide a useful overview of a bowler’s performance.
Consider a bowler who concedes 28 runs in four overs and takes two wickets. The economy rate is seven runs per over, and the bowler has made a meaningful contribution by removing two batters without allowing excessive scoring. Another bowler might concede 20 runs without taking a wicket, applying pressure through accurate bowling. Depending on the match situation, both performances could be valuable. A wicket may be especially important when a dangerous batter is at the crease, while economical bowling can force the opposition to take greater risks against other bowlers.
Major IPL Records at a Glance
Historical records help readers compare individual brilliance with team achievements. The following table highlights several widely recognised IPL milestones and provides a snapshot of the competition’s statistical history.
| Statistical category | Record or achievement | Player or team |
|---|---|---|
| Most career runs | 8,779 runs | Virat Kohli |
| Most career wickets | 233 wickets | Yuzvendra Chahal |
| Highest individual score | 175 not out | Chris Gayle |
| Most runs in one season | 973 runs in 2016 | Virat Kohli |
| Most wickets in one season | 32 wickets | Harshal Patel and Dwayne Bravo |
| Highest team total | 287/3 | Sunrisers Hyderabad |
| Best bowling figures in an innings | 6/12 | Alzarri Joseph |
| Most sixes in IPL history | 313 sixes | Chris Gayle |
These figures reflect the historical records listed in IPL statistical records as of October 2026. Individual totals can change as new matches are played, and some categories depend on how records are defined. The highest team total, for instance, measures a team’s aggregate score in one innings, whereas the highest individual score measures a single player’s contribution. Season records also differ from career records because they cover a specific tournament rather than a player’s entire IPL career.
Team Performance and IPL Winning Trends
Team statistics provide a broader understanding of the competition by showing how franchises perform across multiple seasons. Total wins, losses, win percentages, playoff appearances, championship titles and successful run chases all contribute to a team’s historical profile. Mumbai Indians and Chennai Super Kings have built strong reputations through sustained success, while other franchises have produced memorable campaigns through new combinations, emerging players and tactical innovation. Comparing teams across different seasons requires attention to the number of matches played, changes in squad composition and the conditions under which those results were achieved.
Royal Challengers Bengaluru’s title-winning campaigns have also attracted considerable attention because of the team’s long journey through the competition. Sunrisers Hyderabad’s record-breaking team totals illustrate how aggressive batting strategies can transform scoring expectations. Meanwhile, teams that consistently qualify for the playoffs demonstrate the value of squad depth, dependable leadership and effective planning throughout a long tournament. IPL stats become particularly informative when they distinguish between one exceptional season and a pattern of sustained performance over many years.
How Home Conditions Influence Team Results
Home advantage is an important factor in T20 cricket. Familiarity with pitch behaviour, local weather and ground dimensions can help teams prepare more effectively. Some grounds favour high-scoring matches because the boundaries are relatively short or the pitch offers consistent bounce. Other venues may provide assistance to spin bowlers or reward seamers who can generate movement with the new ball. Teams often select their playing XI according to these conditions, balancing specialist bowlers with batters who are comfortable on the surface.
However, home advantage does not guarantee victory. Opponents can study previous matches, adjust their combinations and develop strategies for particular venues. A team that performs well away from home may demonstrate stronger adaptability, especially when it can succeed on both batting-friendly and bowling-friendly pitches. Analysing venue-specific results alongside overall win percentages helps supporters understand whether a team’s success comes from broad consistency or favourable conditions at particular grounds.
IPL 2026 Stats: Current Season Performance
The 2026 IPL season provides another useful example of how individual statistics reveal changing trends in T20 cricket. Season records list Vaibhav Sooryavanshi among the leading run scorers, with 776 runs and a strike rate of approximately 237.31. Shubman Gill finished with 732 runs, while Sai Sudharsan accumulated 722. These totals demonstrate the influence of batters who can combine substantial run production with rapid scoring. Kohli’s 675 runs and strike rate of 165.85 also illustrate how a player can contribute through a combination of consistency and acceleration.
The bowling leaderboard offers another perspective on the season. Kagiso Rabada led the listed wicket-taking standings with 29 wickets, followed by Bhuvneshwar Kumar with 28 and Jofra Archer with 25. These figures emphasise the importance of bowlers who can repeatedly break partnerships throughout a tournament. Season totals, however, should not be viewed in isolation. The number of matches played, overs bowled, opposition faced and conditions encountered all influence the final figures. Readers using IPL stats to compare 2026 performances with earlier seasons should also consider how scoring rates and tactical expectations have evolved over time.
What the Latest Season Reveals About T20 Cricket
Modern T20 cricket increasingly rewards batters who can shift gears quickly without losing control of their innings. A player may begin by rotating the strike and targeting gaps before attacking specific bowlers later. Others attempt to dominate from the first over, forcing captains to change field placements or introduce alternative bowling options. The performances of high-strike-rate batters in 2026 demonstrate the continuing importance of aggressive scoring, although consistency remains essential across a long competition.

Bowling plans have evolved alongside batting methods. Teams use variations in pace, wide yorkers, slower balls and changes in length to prevent batters from settling into predictable patterns. Captains also consider matchups, such as using spin against a batter who struggles to generate power against turning deliveries. The relationship between these strategies and individual results makes season statistics more meaningful when they are examined alongside the tactical decisions that shape each match.
How Fans Can Analyse IPL Stats More Effectively
Reading cricket numbers becomes easier when the purpose of each statistic is understood. A player comparison should ideally include several measurements instead of focusing on one impressive figure. For batters, runs, average, strike rate and boundary frequency can reveal different aspects of performance. For bowlers, wickets, economy rate, average and strike rate offer complementary information. Team analysis should consider win percentage, scoring rates, wickets lost and success in different match situations.
Fans can use the following simple approach when evaluating performances:
-
Compare players who perform similar roles, such as opening batters or death-over specialists.
-
Check the number of matches and innings played before comparing career totals.
-
Consider strike rate alongside runs and economy rate alongside wickets.
-
Examine venue, opposition and match conditions before drawing conclusions.
This method helps avoid misleading comparisons. A batter who plays fewer innings may have a higher average but a smaller overall contribution. Likewise, a bowler who takes many wickets may have benefited from playing more matches. A fair assessment considers both the quantity and quality of a player’s opportunities.
Another useful approach is to distinguish between career statistics and season-specific performance. Career records reveal longevity and accumulated achievement, while seasonal figures show how a player performed during a particular campaign. Match-by-match data can go further by identifying patterns, such as a batter scoring heavily against pace bowling or a bowler becoming more economical during the middle overs. These details turn basic scorekeeping into a more complete understanding of cricket.
Why IPL Statistics Matter for the Future of the Tournament
Statistics are becoming increasingly important to team management, analysts, commentators and fans. Franchises use performance data to assess potential signings, evaluate player roles and identify tactical weaknesses. Coaches can examine ball-by-ball information to determine which deliveries are most effective against particular batters. Analysts may also study fielding contributions, running between the wickets and partnerships to understand why some teams outperform expectations.
The growing availability of detailed match data has also changed the way supporters follow the IPL. Instead of judging a player solely by a century or a five-wicket haul, fans can examine consistency, scoring efficiency and performance under pressure. These measurements provide a more complete picture, although statistics cannot capture every element of cricket. Communication, confidence, leadership, adaptability and decision-making remain important factors that are difficult to represent through a single number.
Conclusion
The IPL combines individual excellence with team strategy, and statistics help explain how both contribute to success. From Virat Kohli’s extraordinary run-scoring achievements to Yuzvendra Chahal’s wicket-taking record, the competition has produced milestones that demonstrate the different skills required to excel in T20 cricket. Team totals, batting averages, strike rates, bowling economy and season leaderboards each provide a distinct perspective on the game. For readers who want to follow the tournament more closely, IPL stats offer a practical way to compare players, recognise emerging talent and understand tactical decisions. The most reliable conclusions come from examining multiple measurements, considering match conditions and distinguishing historical records from current-season performance. As the competition continues to evolve, these statistics will remain an essential part of understanding its records, rivalries and memorable performances.