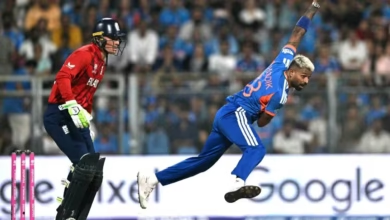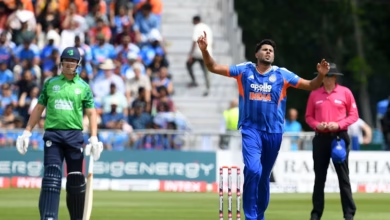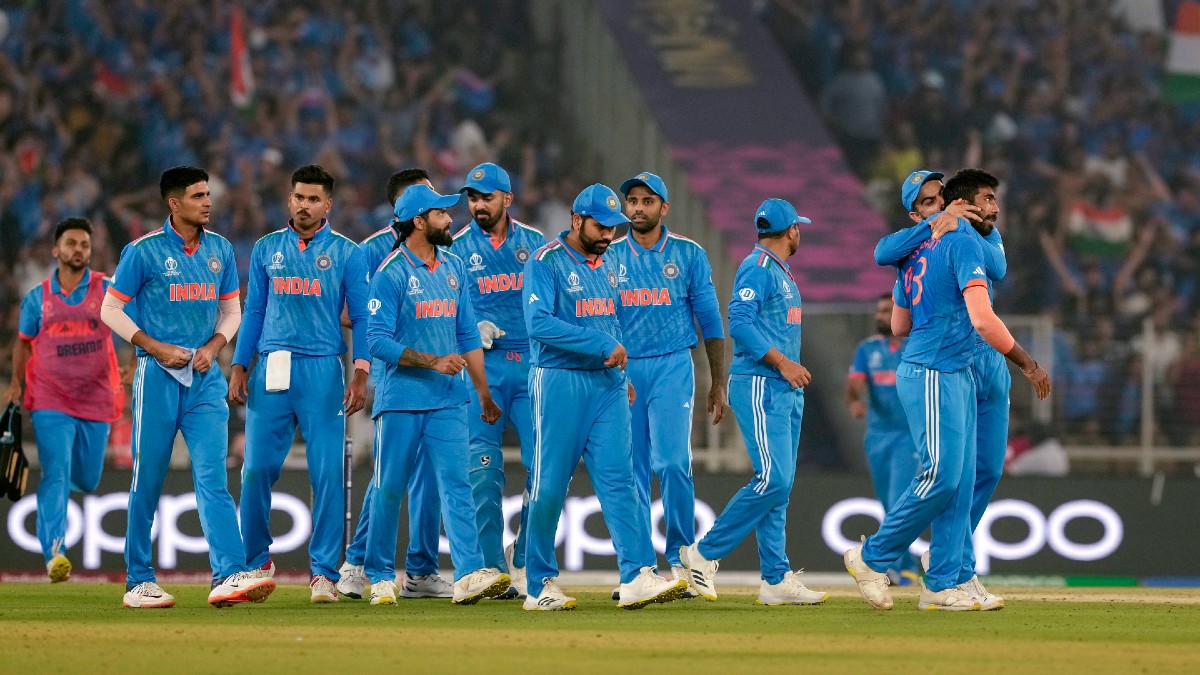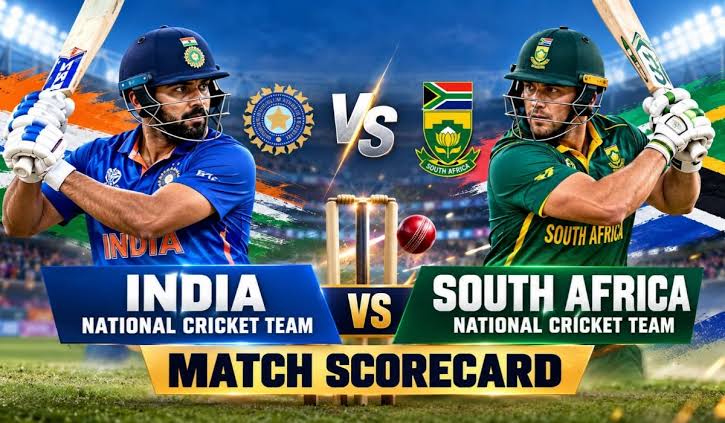
The rivalry between the India national cricket team and the South Africa national cricket team is one of the most exciting contests in international cricket. Both sides have produced memorable performances across Test matches, One Day Internationals (ODIs) and Twenty20 Internationals (T20Is). India is known for its strong batting line-ups, technically gifted players and varied bowling attack, while South Africa has traditionally combined aggressive batting with pace, athletic fielding and disciplined bowling. Whenever these teams meet, fans expect a competitive match in which individual brilliance and team strategy can make a significant difference.
For cricket followers, the india national cricket team vs south africa national cricket team match scorecard is an essential resource for understanding how a game unfolded. It records the runs scored by each batter, wickets taken by bowlers, extras conceded, partnerships and the final result. Rather than simply showing which team won, a detailed scorecard helps readers understand the reasons behind the outcome, including a strong opening partnership, a middle-order collapse, a late batting recovery or a decisive bowling spell.
However, the scorecard depends on the particular match being discussed. India and South Africa have played numerous international fixtures, and their results vary according to the format, venue, playing conditions and tournament. The following guide explains how to interpret their scorecards, assess individual performances and identify the most important moments in a match without confusing statistics from different games.
India National Cricket Team vs South Africa National Cricket Team Match Scorecard: Recent Result
One notable recent meeting between the teams took place on 22 February 2026 during the Super Eight stage of the ICC Men’s T20 World Cup. South Africa delivered a commanding performance, defeating India by 76 runs at the Narendra Modi Stadium in Ahmedabad. The result highlighted the importance of building a competitive first-innings total and maintaining pressure with the ball, particularly in a high-stakes tournament match.
South Africa scored 187 for 7 in 20 overs before dismissing India for 111 in 18.5 overs. David Miller played a crucial role with 63 runs from 35 balls, while Tristan Stubbs added an unbeaten 44 from 24 deliveries. For India, Shivam Dube top-scored with 40 runs. Marco Jansen claimed four wickets for 22 runs, and Keshav Maharaj took three wickets for 24 runs, helping South Africa defend its total convincingly.
Full Match Scorecard and Important Statistics
The following summary presents the main figures from this T20 World Cup encounter. It focuses on the overall team totals and standout individual performances rather than mixing statistics from separate fixtures.
| Match detail | Scorecard information |
|---|---|
| Match | India vs South Africa |
| Date | 22 February 2026 |
| Tournament stage | T20 World Cup Super Eight |
| Venue | Narendra Modi Stadium, Ahmedabad |
| South Africa | 187/7 in 20 overs |
| India | 111 all out in 18.5 overs |
| Result | South Africa won by 76 runs |
| Leading South African batter | David Miller, 63 off 35 balls |
| Leading Indian batter | Shivam Dube, 40 runs |
| Leading South African bowler | Marco Jansen, 4/22 |
| Another key bowling performance | Keshav Maharaj, 3/24 |
These figures explain the main difference between the teams. South Africa recovered from early setbacks to post a challenging total, while India struggled to maintain a steady scoring rate during the chase. The wickets taken by Jansen and Maharaj restricted India’s opportunities to build partnerships and put the target under pressure.
A scorecard should always be read alongside the match situation. A batter scoring 40 runs might have played a valuable innings in a difficult chase, while a bowler taking wickets at crucial moments may have contributed more than the raw figures initially suggest. Understanding the timing of runs and wickets makes the india national cricket team vs south africa national cricket team match scorecard much more useful to readers seeking meaningful match analysis.
South Africa’s Batting Performance
South Africa’s innings demonstrated how a team can recover from a challenging start through middle-order composure and effective finishing. The early batters did not all convert their starts into substantial scores, which created pressure on the players who followed. However, Dewald Brevis contributed 45 runs from 29 balls, giving the innings momentum and helping South Africa rebuild after losing early wickets.
David Miller then provided the defining contribution. His 63 off 35 balls combined calculated shot selection with aggressive stroke play, allowing South Africa to accelerate during the middle and final overs. Miller’s innings was especially important because it helped the team move beyond a merely competitive total. Tristan Stubbs supported him with an unbeaten 44 from 24 balls, adding further momentum through powerful hitting and effective placement. Their contributions ensured that South Africa finished with 187 runs, a total that gave its bowlers room to attack.
Why Miller and Stubbs Made the Difference
In T20 cricket, the middle and death overs frequently determine whether an innings reaches a defendable score. Miller’s ability to rotate the strike while finding boundaries prevented India from controlling the scoring rate for long periods. Stubbs complemented that approach by maintaining an aggressive tempo towards the end. Together, they made South Africa’s innings more effective than its early progress had suggested.
This performance also illustrates why batting depth matters. If a team loses wickets early, its middle order must balance recovery with acceleration. Batting too cautiously can leave too many runs for the final overs, while attacking recklessly can trigger a collapse. South Africa found a productive balance through its key middle-order batters, creating a target that placed substantial pressure on India’s batting line-up.
India’s Batting Performance During the Chase
India entered the chase needing 188 runs from 20 overs, a target that required consistent scoring and partnerships across the innings. However, South Africa’s bowlers quickly put the batting side under pressure. Losing wickets at regular intervals made it difficult for India to establish a reliable foundation, and the required run rate became increasingly demanding as the innings progressed. Rather than allowing the Indian batters to settle, South Africa continued to attack with disciplined lines, changes of pace and well-planned field placements.
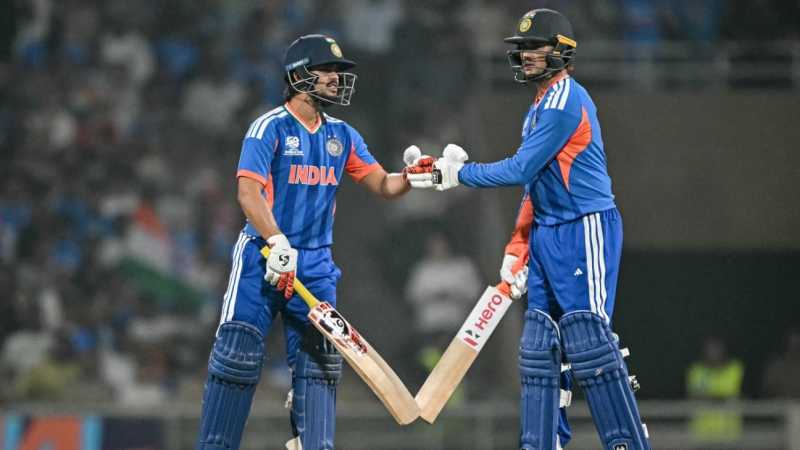
Shivam Dube emerged as India’s leading scorer with 40 runs, but his innings was not enough to bring the team back into contention. The other batters struggled to produce the substantial partnerships needed for a successful chase. In T20 cricket, one batter can change the direction of a match with a rapid half-century, but that contribution is most effective when another player provides support at the opposite end. India’s inability to build such a partnership proved costly, and the team was dismissed for 111 in 18.5 overs.
Where India’s Chase Went Wrong
The india national cricket team vs south africa national cricket team match scorecard shows why the chase became difficult. India’s challenge was not simply the size of the target; it was the combination of wickets lost, scoring pressure and South Africa’s consistent execution. Each dismissal forced the incoming batter to adjust quickly, leaving fewer opportunities to build an innings patiently.
Another important factor was the lack of a sustained acceleration phase. Successful T20 chases often feature a partnership that stabilises the innings before increasing the scoring rate. India could not establish that rhythm against South Africa’s attack. As wickets continued to fall, the batters had to take greater risks, which created additional opportunities for the fielding side. The result was a substantial defeat despite India’s efforts to recover through Dube’s contribution.
South Africa’s Bowling Strategy and Key Wickets
South Africa’s bowling was central to the result. Marco Jansen finished with four wickets for 22 runs, making him the most influential bowler of the match. His performance demonstrated the value of combining pace, accuracy and variations in length. By taking wickets rather than concentrating exclusively on restricting runs, he prevented India from establishing the partnerships required to chase the target.
Keshav Maharaj also played an important role, claiming three wickets for 24 runs. His contribution strengthened South Africa’s control during the middle overs, when batting teams typically look to consolidate before accelerating. A spinner who can maintain pressure and take wickets during this period can change the direction of a T20 contest. Jansen’s breakthroughs and Maharaj’s control worked together to ensure that India never gained sustained momentum.
South Africa’s bowlers also benefited from having 187 runs to defend. They could attack with confidence, set fields for specific batters and force India to attempt difficult shots. The lesson for both teams was clear: effective bowling is not just about taking wickets or limiting boundaries individually. It is about creating pressure collectively, ensuring that one bowler’s effort strengthens the next bowler’s opportunity.
How to Read a Cricket Match Scorecard Correctly
For readers following international cricket, a scorecard contains several statistics that explain the performance of each team. Understanding these figures makes it easier to evaluate a match beyond the final result. The india national cricket team vs south africa national cricket team match scorecard is particularly useful as an example because it shows the contrast between South Africa’s productive middle-order batting and India’s unsuccessful chase.
The most important figures to examine include:
-
Runs and balls faced: These indicate a batter’s scoring contribution and how quickly the runs were made.
-
Overs and wickets: These show how much of the innings was completed and how many batters were dismissed.
-
Bowling figures: Runs conceded, overs bowled and wickets taken help measure a bowler’s effectiveness.
-
Extras and partnerships: These reveal additional runs awarded and how batters combined to build the innings.
Strike rate is another valuable batting statistic in limited-overs cricket. It measures the number of runs scored per 100 balls faced. A batter making 40 runs from 20 balls has a strike rate of 200, while someone scoring 40 from 40 balls has a strike rate of 100. Both have scored the same number of runs, but their impact on the scoring rate is very different.
Bowling economy provides a similar perspective on the other side of the game. It measures the average runs conceded per over. However, economy should not be considered in isolation because a bowler may concede runs while taking important wickets, or maintain a low economy without creating many dismissal opportunities. A balanced reading of the statistics provides a clearer picture of individual contributions.
Differences Between Test, ODI and T20 Scorecards
India and South Africa compete in three major international formats, and each requires a different approach to scorecard analysis. Test cricket can last up to five days, making batting endurance, bowling spells, pitch deterioration and the management of multiple innings important. A Test scorecard may show two innings for each team, declared totals and the number of overs or balls faced. A large first-innings total can create pressure, but a match may still change direction through a second-innings collapse or a resilient batting partnership.
ODI cricket offers 50 overs per team in a standard uninterrupted innings. Scorecards in this format often reflect a balance between building a foundation and accelerating towards the end. Readers should pay attention to powerplay scoring, middle-over partnerships, wickets remaining and the final ten overs. A total that appears competitive at the halfway stage may become difficult to defend if the batting side finishes strongly, while a disciplined bowling performance can turn an apparently comfortable chase into a close contest.
T20 cricket is played over 20 overs per side, making every over and wicket particularly influential. Strike rates, boundary counts, bowling economy and performances during the final overs receive considerable attention. The February 2026 encounter is an example of how quickly the balance can shift: South Africa recovered through its middle order, then used regular wickets to prevent India from mounting a serious chase. Comparing scorecards across formats therefore requires an understanding of the different tactical demands involved.
Head-to-Head Rivalry and Memorable Encounters
The history of India versus South Africa cricket includes close finishes, commanding victories and performances that have shaped tournament campaigns. Both teams have demonstrated strengths in different conditions. India has frequently relied on its batting depth and spin options, particularly on slower surfaces, while South Africa has often used pace, bounce and aggressive middle-order batting to challenge opponents. These broad characteristics are not fixed rules, however, because team selection, player form and conditions influence every match.
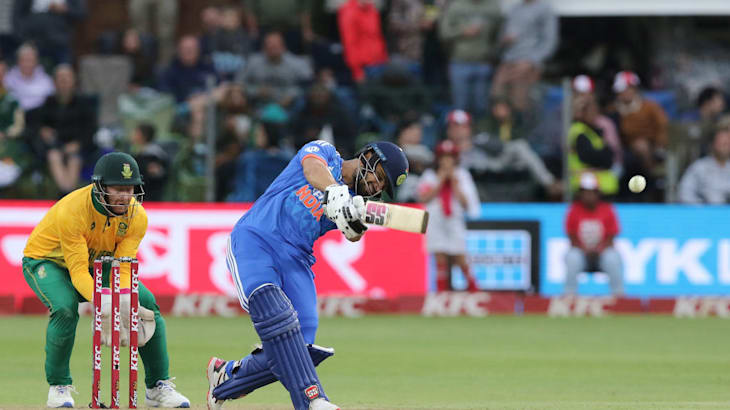
One of the most memorable recent meetings was the men’s T20 World Cup final on 29 June 2024. India scored 176 for 7, while South Africa finished on 169 for 8, giving India a seven-run victory. The close finish demonstrated how a match can turn in its final overs, even when the chasing team appears well positioned. The contest remains a useful example of the importance of death bowling, composure under pressure and taking wickets at critical moments.
In bilateral series, the rivalry can look very different from a single World Cup match. A team might lose one game heavily but respond with a strong performance in the next fixture. Test series also test adaptability over several days and matches, while ODI and T20I series require teams to make rapid adjustments to batting combinations, bowling plans and conditions. Reviewing a collection of scorecards helps identify these patterns without assuming that one result determines the overall strength of either side.
What Fans Should Check Before Searching for a Match Scorecard
Because India and South Africa meet regularly, the match date and format are essential when searching for a particular result. The same two teams can produce completely different scorecards within a few weeks, and statistics from a T20I should never be confused with those from an ODI or Test. Readers should also distinguish between a completed match, a live score and a pre-match preview.
Before analysing a result, check the following details:
-
The match date, tournament and format.
-
The venue and which team batted first.
-
The final totals, wickets lost and overs completed.
-
The leading batters, wicket-takers and official match result.
These simple checks help prevent common errors when comparing statistics or preparing match reports. They are especially useful for writers and cricket enthusiasts who want to explain why a team won rather than merely repeat the final score.
Conclusion
The india national cricket team vs south africa national cricket team match scorecard offers more than a record of runs and wickets. It provides a structured account of how batting partnerships, bowling spells, scoring rates and pressure influenced the result. South Africa’s 76-run victory in the T20 World Cup Super Eight encounter on 22 February 2026 highlighted the impact of David Miller’s 63, Tristan Stubbs’ unbeaten 44 and Marco Jansen’s four-wicket performance. India’s struggle to build partnerships during the chase ultimately prevented it from challenging the target.
For readers who want a deeper understanding of international cricket, the best approach is to combine scorecard figures with the match context. Check the format, examine individual performances, identify the turning points and consider how the conditions influenced each team’s strategy. This approach makes every scorecard more informative and helps fans appreciate the tactical decisions and individual skills behind one of cricket’s most competitive international rivalries.