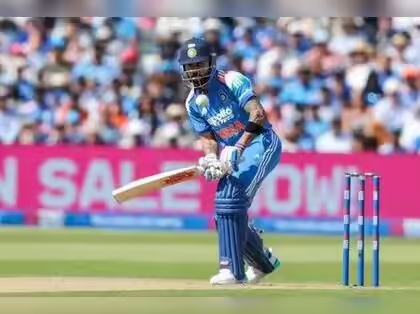
The rivalry between the South Africa national cricket team and the India national cricket team has produced some of the most competitive moments in international cricket. Both sides have developed strong reputations for their batting depth, disciplined bowling attacks, athletic fielding and ability to perform under pressure. Whether they meet in Test matches, One Day Internationals (ODIs) or Twenty20 Internationals (T20Is), their contests often feature changing momentum, impressive individual performances and tactical battles that keep cricket fans interested until the final delivery.
For fans who want to understand the match beyond the final result, the south africa national cricket team vs india national cricket team match scorecard provides an important overview of how the game unfolded. It helps readers examine each team’s total, individual batting contributions, wickets lost, bowling figures, extras and partnerships. A scorecard also makes it easier to compare performances and identify the moments when one team gained control or the other fought its way back into contention.
Because India and South Africa compete across different formats and tournaments, it is important to identify the specific fixture before interpreting a scorecard. A Test match can extend across several days, while an ODI usually involves 50 overs per side and a T20I is limited to 20 overs per innings. The venue, pitch conditions, weather and toss can all influence the result. Therefore, a useful scorecard analysis should explain not only the numbers but also what those numbers reveal about the match.
South Africa vs India Match Details and Final Result
One of the major recent encounters between these teams took place on 22 February 2026 during the Super Eight stage of the ICC Men’s T20 World Cup. The match was played at the Narendra Modi Stadium in Ahmedabad, where South Africa won the toss and elected to bat first. The decision became an important part of the contest because South Africa recovered from an early collapse and produced a competitive total before restricting India’s batting lineup. South Africa finished on 187 runs for seven wickets in 20 overs, while India were bowled out for 111 in 18.5 overs. South Africa secured a convincing 76-run victory.
| Match information | Details |
|---|---|
| Match | India vs South Africa |
| Tournament | ICC Men’s T20 World Cup 2026 |
| Stage | Super Eight |
| Date | 22 February 2026 |
| Venue | Narendra Modi Stadium, Ahmedabad |
| Toss | South Africa won and chose to bat |
| South Africa | 187/7 in 20 overs |
| India | 111 all out in 18.5 overs |
| Result | South Africa won by 76 runs |
| Player of the Match | David Miller |
The south africa national cricket team vs india national cricket team match scorecard from this fixture highlights the importance of recovering after losing early wickets. South Africa’s middle order turned a difficult start into a strong finish, while India’s batters struggled to establish partnerships during the chase. The result also ended India’s 12-match unbeaten streak at the Men’s T20 World Cup, making the encounter particularly significant in the tournament’s context.
South Africa Batting Scorecard: A Strong Middle-Order Recovery
South Africa’s innings began under pressure. Captain Aiden Markram scored four runs, Quinton de Kock made six, and Ryan Rickelton contributed seven. India’s opening bowlers, especially Jasprit Bumrah, used accurate lines and lengths to take early wickets and prevent South Africa from building immediate momentum. With three wickets down for only 20 runs, the batting side needed a partnership capable of changing the direction of the innings.
Dewald Brevis and David Miller delivered that response. Brevis scored 45 runs from 29 balls, including three fours and three sixes, while Miller made 63 from 35 deliveries, striking seven fours and three sixes. Their 97-run partnership from 51 balls gave South Africa the foundation it needed. Tristan Stubbs then remained unbeaten on 44 from 24 balls, adding late acceleration to the innings. His finishing contribution helped South Africa reach 187/7, a total that put considerable pressure on India’s top order.
South Africa Batting Figures
The key batting performances in the south africa national cricket team vs india national cricket team match scorecard are summarised below in prose to explain how the innings developed. Markram’s four, de Kock’s six and Rickelton’s seven reflected India’s successful start with the ball. Brevis and Miller then combined aggression with calculated shot selection, while Stubbs ensured that South Africa did not lose momentum during the final overs. Marco Jansen scored two, Corbin Bosch made five, and Kagiso Rabada remained unbeaten on zero. South Africa’s total also included 11 extras.
Miller’s innings was especially valuable because he balanced boundary hitting with the ability to keep the scoreboard moving. Brevis attacked the bowling when South Africa needed a change in momentum, and Stubbs capitalised on the platform established by the pair. Instead of relying on one batter alone, South Africa received substantial contributions from three players, which made the innings more difficult for India to contain.
India Bowling Performance and Key Wickets
India’s bowling performance had two distinct phases. The opening spell was effective, with Bumrah taking three wickets for 15 runs in four overs. Arshdeep Singh also claimed two wickets, while Shivam Dube took one. These breakthroughs initially put South Africa under pressure and demonstrated how accurate fast bowling can restrict even an aggressive batting lineup. However, the middle overs proved more expensive as Brevis and Miller attacked the spin options and rebuilt the innings.
The south africa national cricket team vs india national cricket team match scorecard illustrates why early wickets alone do not guarantee control. India’s bowlers had to break the partnership quickly, but South Africa’s batters managed the situation well. Varun Chakaravarthy conceded 47 runs in four overs, while Washington Sundar gave away 17 in two overs. Hardik Pandya conceded 45 runs in four overs. Although India continued taking wickets later in the innings, South Africa had already established enough momentum to finish with a challenging total.
India Batting Scorecard: Why the Chase Fell Short
India began their chase of 188 runs with the expectation of making use of their powerful batting lineup. However, South Africa’s bowlers quickly disrupted those plans. Ishan Kishan was dismissed for a duck, and Abhishek Sharma managed only 15 runs. Tilak Varma fell for one, leaving India struggling to establish a stable start. By the end of the powerplay, India were 31/3, which meant the required run rate was already climbing while the team had lost three important wickets.
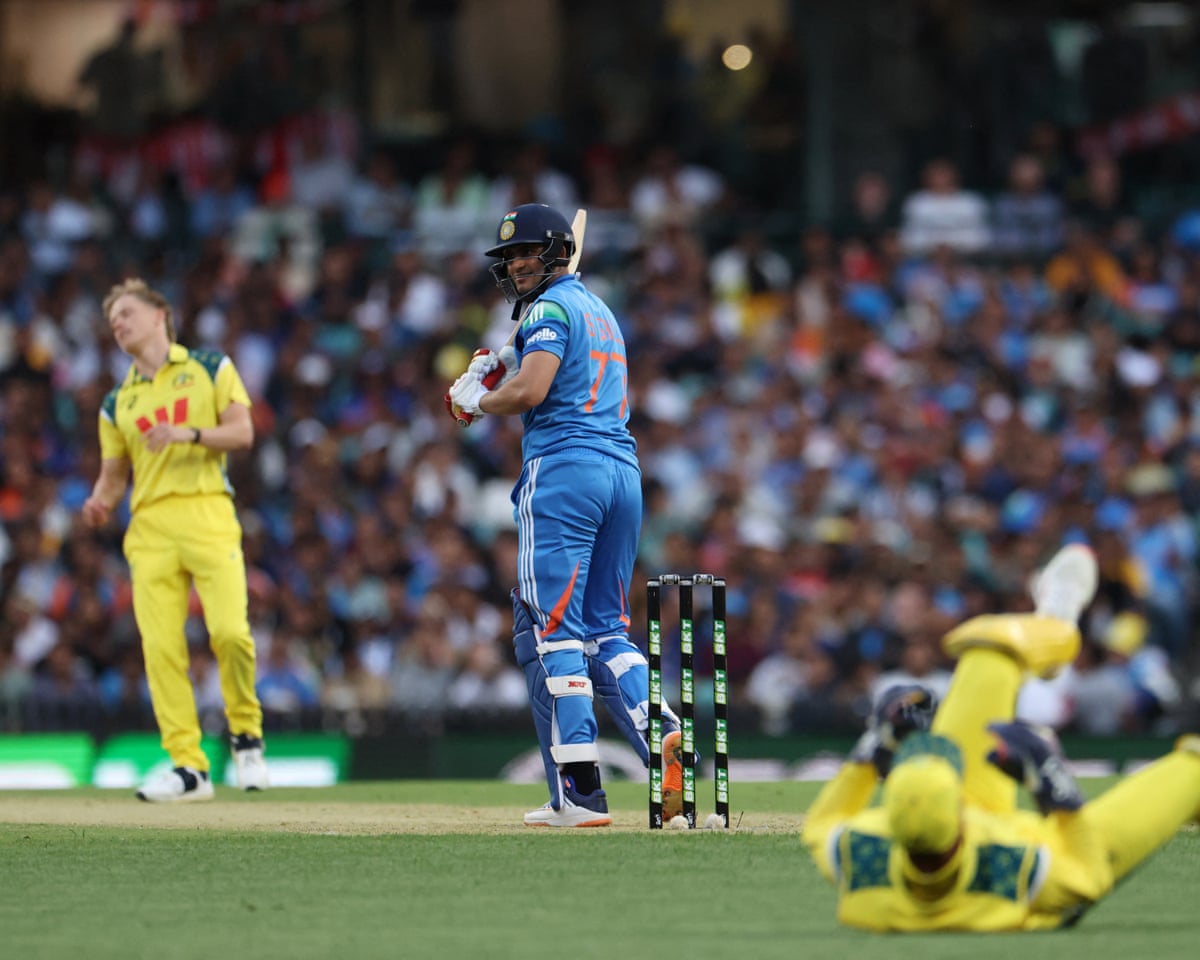
Suryakumar Yadav scored 18, Washington Sundar made 11, and Hardik Pandya contributed 18. Shivam Dube was India’s leading scorer with 42 runs from 37 balls, including one four and three sixes. However, he received insufficient support from the other end. Rinku Singh was dismissed without scoring, Arshdeep Singh made one, and Jasprit Bumrah also failed to score. Varun Chakaravarthy remained unbeaten on zero when India’s innings ended at 111 in 18.5 overs. The south africa national cricket team vs india national cricket team match scorecard therefore shows a significant gap between India’s early expectations and its eventual batting performance.
India Batting Figures at a Glance
India’s innings was characterised by frequent wickets and a lack of substantial partnerships. The most important individual contribution came from Dube, whose resistance prevented the total from becoming even smaller. However, his innings was not enough to reverse the pressure created by South Africa’s bowlers. In a T20 chase, batters need to balance risk with consistency, and India struggled to find that balance after losing early wickets.
The collapse also demonstrated the importance of partnerships in a high-pressure match. Even when a batter is scoring at a reasonable pace, the team can fall behind if wickets continue to fall at the other end. India needed one or two extended partnerships to keep the chase alive, but South Africa prevented that from happening.
South Africa Bowling Scorecard and Match-Winning Spell
South Africa’s bowling attack was instrumental in securing the victory. Marco Jansen delivered the standout performance, taking four wickets for 22 runs in 3.5 overs. His ability to strike early damaged India’s top order and prevented the opening batters from settling into their innings. Jansen combined movement with disciplined execution, forcing India’s batters to play under pressure rather than freely attack the scoring areas.
Keshav Maharaj also played a decisive role, taking three wickets for 24 runs. His breakthroughs included important middle-order dismissals that prevented India from building a recovery partnership. Corbin Bosch claimed two wickets for 12 runs in three overs, adding further pressure through economical bowling and timely breakthroughs. Lungi Ngidi contributed with a controlled spell, conceding only 15 runs in four overs. Together, the South African bowlers maintained pressure throughout the chase, ensuring that India could not turn individual starts into a meaningful partnership.
Key Turning Points That Decided the Match
Several moments explain why South Africa won so convincingly. The south africa national cricket team vs india national cricket team match scorecard becomes more meaningful when these turning points are considered alongside the final totals.
-
India’s early bowling success: Bumrah’s accurate opening spell and the early wickets reduced South Africa to 20/3, creating an opportunity for India to restrict the total.
-
The Miller-Brevis partnership: Their 97-run stand from 51 balls changed the momentum and gave South Africa a strong platform.
-
Stubbs’ late acceleration: His unbeaten 44 from 24 balls pushed South Africa towards a total that demanded an aggressive chase.
-
Jansen’s early breakthroughs: His four-wicket haul dismantled India’s top order and made the target increasingly difficult to reach.
These moments demonstrate how quickly a T20 match can change direction. India initially appeared capable of controlling South Africa’s innings, but the middle-order partnership altered the contest. Later, South Africa’s bowlers prevented India from building any comparable stand. The match was ultimately decided by the difference between South Africa’s recovery and India’s inability to recover from early setbacks.
What the Scorecard Reveals About Both Teams
The south africa national cricket team vs india national cricket team match scorecard offers several lessons about modern T20 cricket. South Africa showed that an early collapse does not necessarily determine the final outcome. The team responded by identifying scoring opportunities, building a substantial partnership and accelerating at the right time. Miller and Brevis provided the foundation, while Stubbs supplied the finishing power. This combination of recovery and acceleration allowed South Africa to post 187 runs despite losing wickets early.
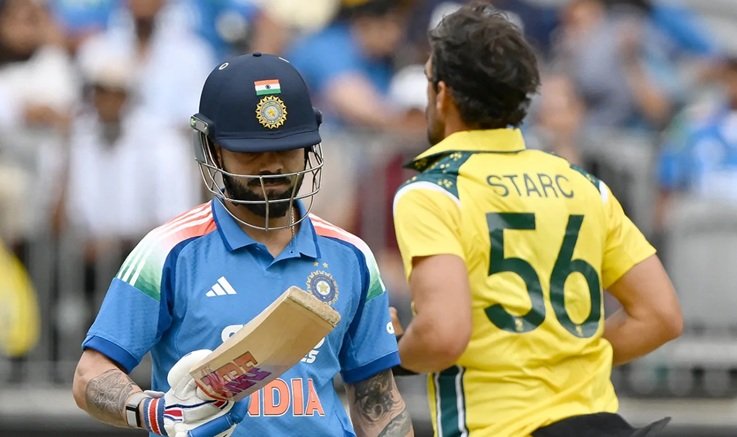
India’s performance highlighted the challenges of chasing a demanding total after a poor start. A target of 188 was challenging but not impossible on a batting-friendly surface. However, losing three wickets during the powerplay forced the middle order to take greater risks. South Africa exploited that situation through disciplined bowling, smart variations and well-executed fielding. India’s inability to sustain partnerships meant that the required run rate became less important than simply preserving wickets and finding a way to rebuild.
The match also demonstrated the value of adaptability. South Africa adjusted after its difficult opening, whereas India could not find an effective response once the chase began to unravel. These differences in decision-making and execution were reflected directly in the final scorecard.
How to Read a Cricket Match Scorecard Correctly
For readers who regularly follow international cricket, understanding the main scorecard statistics makes match analysis more useful. The south africa national cricket team vs india national cricket team match scorecard includes several figures that explain individual contributions and the overall result.
Runs indicate how much a batter scored, while balls faced show how many deliveries were required. The strike rate measures runs scored per 100 balls and is particularly important in T20 cricket. For bowlers, wickets and runs conceded help assess effectiveness, while the economy rate shows the average runs allowed per over. Extras include wides, no-balls, byes and leg-byes, which contribute to the team’s total without being credited directly to a batter.
The fall of wickets records when dismissals occurred and helps identify periods of pressure. Partnerships show how batters combined to build the innings, while the final result explains whether a team won by runs, wickets or another method. Reading these details together gives a much clearer picture than looking at the final score alone.
Conclusion
The South Africa versus India encounter at the 2026 ICC Men’s T20 World Cup was a compelling example of how partnerships, bowling discipline and composure can decide a high-profile cricket match. South Africa recovered from an early collapse to score 187/7, thanks to David Miller’s 63, Dewald Brevis’s 45 and Tristan Stubbs’s unbeaten 44. India, meanwhile, struggled to establish partnerships and were dismissed for 111 in 18.5 overs, handing South Africa a 76-run victory.
For anyone examining the south africa national cricket team vs india national cricket team match scorecard, the central lesson is that a strong start must be supported by consistent execution throughout the innings. South Africa demonstrated resilience with the bat and precision with the ball, while India could not recover from the pressure created by early wickets. The performances of Miller, Jansen and Maharaj were especially influential in determining the outcome.
A detailed scorecard remains one of the best ways to understand the story behind a cricket result. By examining batting figures, bowling performances, partnerships and turning points together, fans can appreciate not only who won but also why the match unfolded as it did.