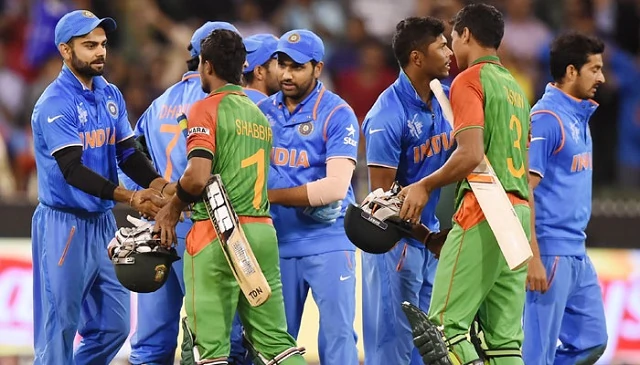
The Indian Premier League (IPL) has transformed cricket into a fast-paced sporting spectacle where individual brilliance, team strategy and match-winning performances combine to create unforgettable moments. Since its launch in 2008, the tournament has featured powerful batting displays, remarkable bowling spells, dramatic finishes and intense competition between franchises. Every season introduces new performers while experienced players continue to shape the competition through consistency and tactical awareness. For fans who want to understand the game beyond the final score, statistics offer a valuable way to examine how matches unfold and why certain performances become decisive.
IPL stats provide a detailed picture of player achievements, team results and changing patterns in T20 cricket. They cover everything from runs, wickets and batting averages to strike rates, economy rates, partnerships and individual milestones. These numbers help supporters compare players from different seasons, understand the strengths of competing teams and appreciate contributions that might not be obvious from a highlights package. A batter scoring 35 runs from 15 deliveries, for example, may influence a match more significantly than someone scoring 45 from 40 balls, depending on the target, pitch and match situation.
Statistics also make cricket discussions more meaningful by replacing assumptions with measurable evidence. However, numbers should always be interpreted in context. A player’s record on a batting-friendly pitch may differ considerably from performances on a slow surface, while a bowler’s economy rate can be affected by the quality of opposition batters and the stage of the innings. Understanding these details allows fans to develop a balanced view of performances instead of judging players through a single record or headline figure.
Understanding the Importance of IPL Stats
IPL statistics help explain the relationship between individual contributions and team success. Batting numbers reveal how effectively players score runs, bowling figures show how they restrict opposition scoring, and fielding records highlight the importance of catches and run-outs. Together, these measurements provide a broader understanding of a match than the final scorecard alone. Coaches, analysts, commentators and supporters use statistical evidence to identify strengths, assess weaknesses and discuss tactical decisions.
For example, a team may have several batters capable of scoring boundaries but struggle to maintain momentum during the middle overs. Its overall run total might appear competitive, yet a closer examination of scoring rates could reveal why it repeatedly falls short of large targets. Similarly, a bowling attack might take plenty of wickets but concede too many runs during the powerplay. Examining over-by-over performance can uncover these patterns and explain why a team performs differently against different opponents.
Statistics are also useful when comparing performances across seasons. Since teams, player roles, ground conditions and tournament strategies change, historical figures need careful interpretation. A record established under one set of conditions may not be directly comparable with a recent achievement. The most useful analysis considers the numbers alongside the circumstances in which they were produced.
IPL 2026 Statistics: The Latest Season at a Glance
The 2026 season demonstrated how rapidly T20 cricket continues to evolve. Based on the completed season’s reported figures, Vaibhav Sooryavanshi led the batting charts with 776 runs for Rajasthan Royals, while Kagiso Rabada finished as the leading wicket-taker with 29 wickets. Royal Challengers Bengaluru secured the championship after defeating Gujarat Titans in the final. These performances illustrate the impact of aggressive batting, wicket-taking bowlers and team execution under pressure.
| Statistical category | Player | 2026 achievement |
|---|---|---|
| Most runs | Vaibhav Sooryavanshi | 776 |
| Second-most runs | Shubman Gill | 732 |
| Third-most runs | Sai Sudharsan | 722 |
| Most wickets | Kagiso Rabada | 29 |
| Second-most wickets | Bhuvneshwar Kumar | 28 |
| Third-most wickets | Jofra Archer | 25 |
| Highest individual score | KL Rahul | 152 |
| Most sixes | Vaibhav Sooryavanshi | 72 |
Batting Records That Define IPL Performances
Total Runs and Batting Average
Total runs are among the most familiar measures of batting success. They show how much a player has contributed across a season or throughout their IPL career. However, a high aggregate does not automatically mean that a batter has been the most consistent performer. The number of innings played, opportunities received and frequency of dismissals all influence the total. A player who scores regularly across many matches may provide more dependable value than one whose runs come primarily from a few exceptional innings.
Batting average offers another perspective by measuring runs scored per dismissal. It is calculated by dividing total runs by the number of times the batter has been dismissed. A high average generally suggests an ability to remain at the crease and contribute substantial scores. Nevertheless, averages must be considered alongside strike rates and batting positions. An opener who builds an innings has a different responsibility from a lower-order finisher expected to score rapidly in the final overs.
Strike Rate and Boundary Hitting
Strike rate measures how quickly a batter scores. In T20 cricket, it is particularly important because each team has a limited number of deliveries available. A batter scoring 60 runs from 30 balls has a strike rate of 200, whereas 60 runs from 50 balls produces a strike rate of 120. Although both innings contribute the same number of runs, their effect on the team’s scoring momentum can be very different.
Boundary statistics add further detail to this comparison. Fours demonstrate the ability to find gaps and use placement, while sixes indicate the capacity to clear the boundary. Modern IPL batting often involves calculated aggression, with players targeting particular bowlers, fielding positions or overs. Yet boundary hitting is not the only measure of effectiveness. Rotating the strike, avoiding dot balls and building partnerships can be equally important when a pitch makes aggressive shots difficult.
Bowling Statistics and Their Impact on Matches
Bowling figures help explain how teams control scoring and create opportunities to take wickets. The total number of wickets is an obvious measure of success, but it should not be considered in isolation. A bowler may take several wickets while conceding many runs, whereas another may take fewer wickets but restrict the opposition to a low scoring rate. Both contributions can be valuable depending on the match situation, target and quality of the opposing batting lineup.
Economy rate measures the average number of runs conceded per over. For example, a bowler who gives away 24 runs in four overs has an economy rate of six runs per over. Bowling average measures runs conceded per wicket taken, while bowling strike rate indicates the number of deliveries required, on average, to claim a wicket. Used together, these indicators reveal more about a bowler’s performance than any single figure. They also help explain why specialists are selected for different phases of a T20 innings.
Death-over bowling presents a particularly difficult challenge because batters frequently attack from the beginning of each delivery. Yorkers, slower balls, wide lines and changes in pace can reduce scoring opportunities, but execution must remain precise. A bowler with a strong overall record may still struggle in the final overs if the pitch offers little assistance or the batter reads variations effectively. This is why phase-specific analysis is essential when evaluating bowling performances.
Team Performance, Points Tables and Winning Trends
Team statistics provide a broader view of how franchises perform over a complete season. Wins, losses, net run rate, points and head-to-head results help explain which teams progress to the playoffs and which struggle to maintain consistency. A team might win several matches through strong batting, while another may depend on disciplined bowling and successful run chases. Looking at these patterns makes it easier to understand why different combinations can succeed under different conditions.
The points table is particularly useful because it measures progress across the league stage rather than focusing on one match. When teams finish with similar points, net run rate can become an important factor in determining their positions. It reflects the relative scoring rates of teams across eligible matches, subject to competition rules. A convincing victory can improve net run rate, while a narrow defeat may limit the damage. However, teams must balance the desire for a large win with the need to secure the result.
Team comparisons become more meaningful when they include powerplay scoring, middle-over control, death-over performance and success while chasing. These measures reveal whether a franchise is effective throughout the innings or relies heavily on one phase. They also help explain why a team with talented individual players might not achieve consistent results: cricket requires coordinated contributions, sensible selection and good decisions under pressure.
How to Read IPL Stats Like a Cricket Analyst
Understanding cricket statistics does not require advanced mathematical knowledge. The most useful approach is to combine a few relevant measures and ask what they reveal about the match. For example, if a batter has a high strike rate but a low average, the player may be an aggressive scorer whose innings are often short. If a bowler has a low economy rate but relatively few wickets, the player may be effective at restricting runs without regularly breaking partnerships. Neither profile is automatically better; the team’s requirements determine the value of each contribution.
For a more structured analysis, focus on these areas:
-
Batting: Compare runs, average, strike rate and boundary percentage to understand scoring ability.
-
Bowling: Examine wickets, economy rate, bowling average and strike rate together.
-
Team results: Review wins, losses, net run rate and performance in different innings situations.
-
Match context: Consider pitch conditions, opposition quality, batting position and the stage of the tournament.
These comparisons are especially useful when evaluating emerging players against established international stars. A young batter might have fewer career runs simply because they have played fewer matches. Comparing average performance, scoring speed and consistency within similar roles provides a fairer assessment. Similarly, a bowler who regularly performs in difficult death overs should not be evaluated in exactly the same way as a specialist who mainly bowls during the powerplay.
Another important consideration is sample size. A player who has performed exceptionally in three matches may not maintain the same figures across an entire season. Longer records provide a stronger basis for judging consistency, although changes in form and playing conditions can still influence results. Reliable analysis therefore combines numerical evidence with observation rather than treating a short statistical streak as a guaranteed prediction of future performance.
Historical Records and the Evolution of T20 Cricket
The IPL’s history offers an opportunity to examine how cricket strategies have developed since 2008. Earlier seasons featured different team combinations, playing conditions and approaches to scoring. Over time, improved fitness, more specialised coaching, data analysis and increasingly ambitious shot selection have influenced batting and bowling tactics. Players now frequently practise shots designed to target areas outside conventional scoring zones, while bowlers develop variations intended to counter aggressive batters.
Historical IPL stats are valuable because they allow fans to place current achievements within a wider context. Comparing career totals can reveal longevity, while season-by-season records show how performance changes over time. A batter who consistently contributes across multiple seasons demonstrates a different kind of achievement from someone who produces one extraordinary campaign. Likewise, a bowler who adapts successfully to changing conditions can provide lasting value even if their wicket totals fluctuate from year to year.
However, historical comparisons need appropriate context. The number of matches played, tournament format, team composition and individual roles can all affect cumulative figures. A player who has appeared in many seasons naturally has more opportunities to accumulate runs or wickets. For that reason, career totals should ideally be considered alongside per-match performance, averages and other relevant indicators.
Common Mistakes When Comparing Cricket Statistics
One frequent mistake is assuming that the player with the highest run total must have been the most effective batter in every situation. Total runs are important, but a team’s needs may call for rapid scoring, steady accumulation or an unbeaten finishing contribution. Similarly, the bowler with the most wickets may have played more matches or bowled more overs than a competitor. Understanding opportunity and role prevents misleading comparisons.
Another common error is treating statistics as reliable predictions of individual match outcomes. Past performances can identify tendencies, but cricket remains influenced by conditions, selection decisions, injuries, pressure and unexpected events. Even players with excellent records can have difficult matches, while less experienced competitors can deliver exceptional performances. Statistics should inform analysis, not replace uncertainty with false confidence.
Readers should also distinguish verified tournament figures from unofficial estimates, outdated tables or incomplete datasets. Current-season statistics can change during a competition, and historical records may be presented differently depending on the categories being measured. Checking the season, match count and definition of each metric helps ensure that comparisons remain accurate and useful.
Conclusion
IPL statistics provide a practical way to understand the competition’s most memorable performances, tactical decisions and changing cricket trends. Batting runs, strike rates, bowling averages, wickets, team points and net run rate each explain a different aspect of the game. When these measures are considered together, they offer a more complete picture of how players contribute and why teams succeed. For cricket enthusiasts, the real value of IPL stats lies in looking beyond individual numbers. A high-scoring innings becomes more impressive when its match situation is understood, while an economical bowling spell gains significance when its effect on the opposition’s momentum is considered. Team records similarly reveal the importance of consistency, adaptability and collective execution throughout a season.